Crime in Portland Oregon 2014
The data presented in this document is public data and can be found here.
Not all types of crime from the data set are covered in this summary document. The ones focused on here are: Drug offenses, Assault, Robbery, DUIs, Sex offenses and Rape.
Importantly, this data set contains raw numbers of crimes reported and doesn’t take into account things like population density. Furthermore, the crimes were categorized by “major offense committed”. I think this means that if someone committed multiple crimes during one outing, the most serious offense was the only one counted for each incident. Finally, both aggravated and simple assault were lumped together for the sake of brevity.
Overall Crime 2014
Below is an interactive graph of the covered crimes over 2014. You can zoom into specific time-periods to see trends. Importantly, this is a “stacked” line chart. This means that the lines indicating the different types of crimes are stacked on top of one another. This strategy allows you to clearly see the patterns in each crime type, but it also means that you must look at the stop and start of each color region on the y-axis to find out how many crimes were actually commited for that type. Altnernatively, you can hover over data points and a pop-up window will give you the counts for each crime area for that day.
For example, on February 9th there is a dramatic decrease in all of the examined crimes. I did a web search on this date and it turns out there was a enormous snow storm the night before. I guess weather slows down everyone, including criminals!
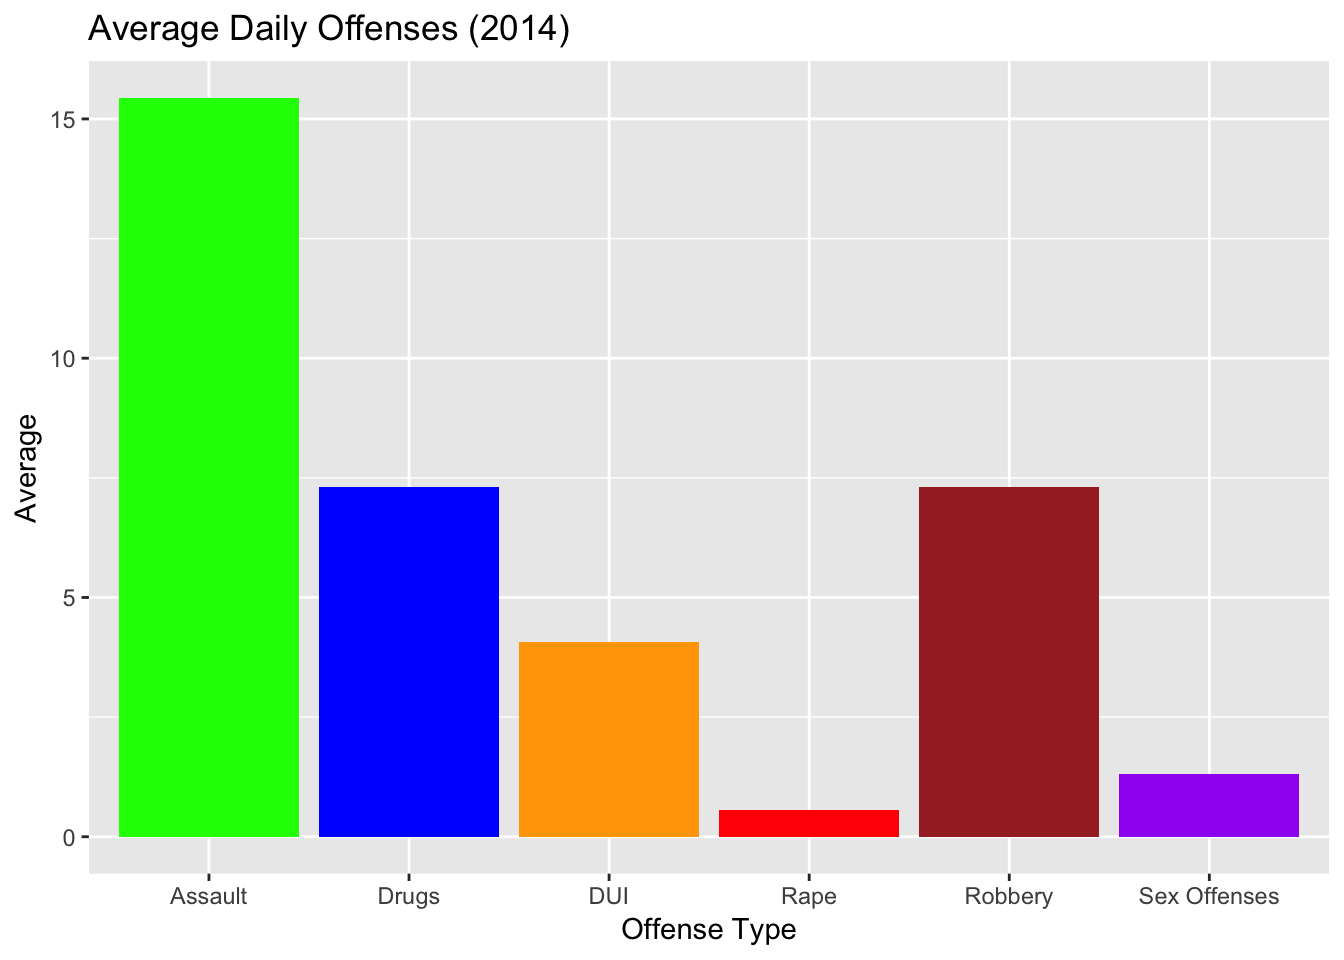
Conversely, there is an uptick in crime on July 5th, which is the Saturday immediately after the holiday. It turns out we like to celebrate our independence with more than just fireworks, there were 32 assaults that day, which is more than twice the yearly average (15.4).
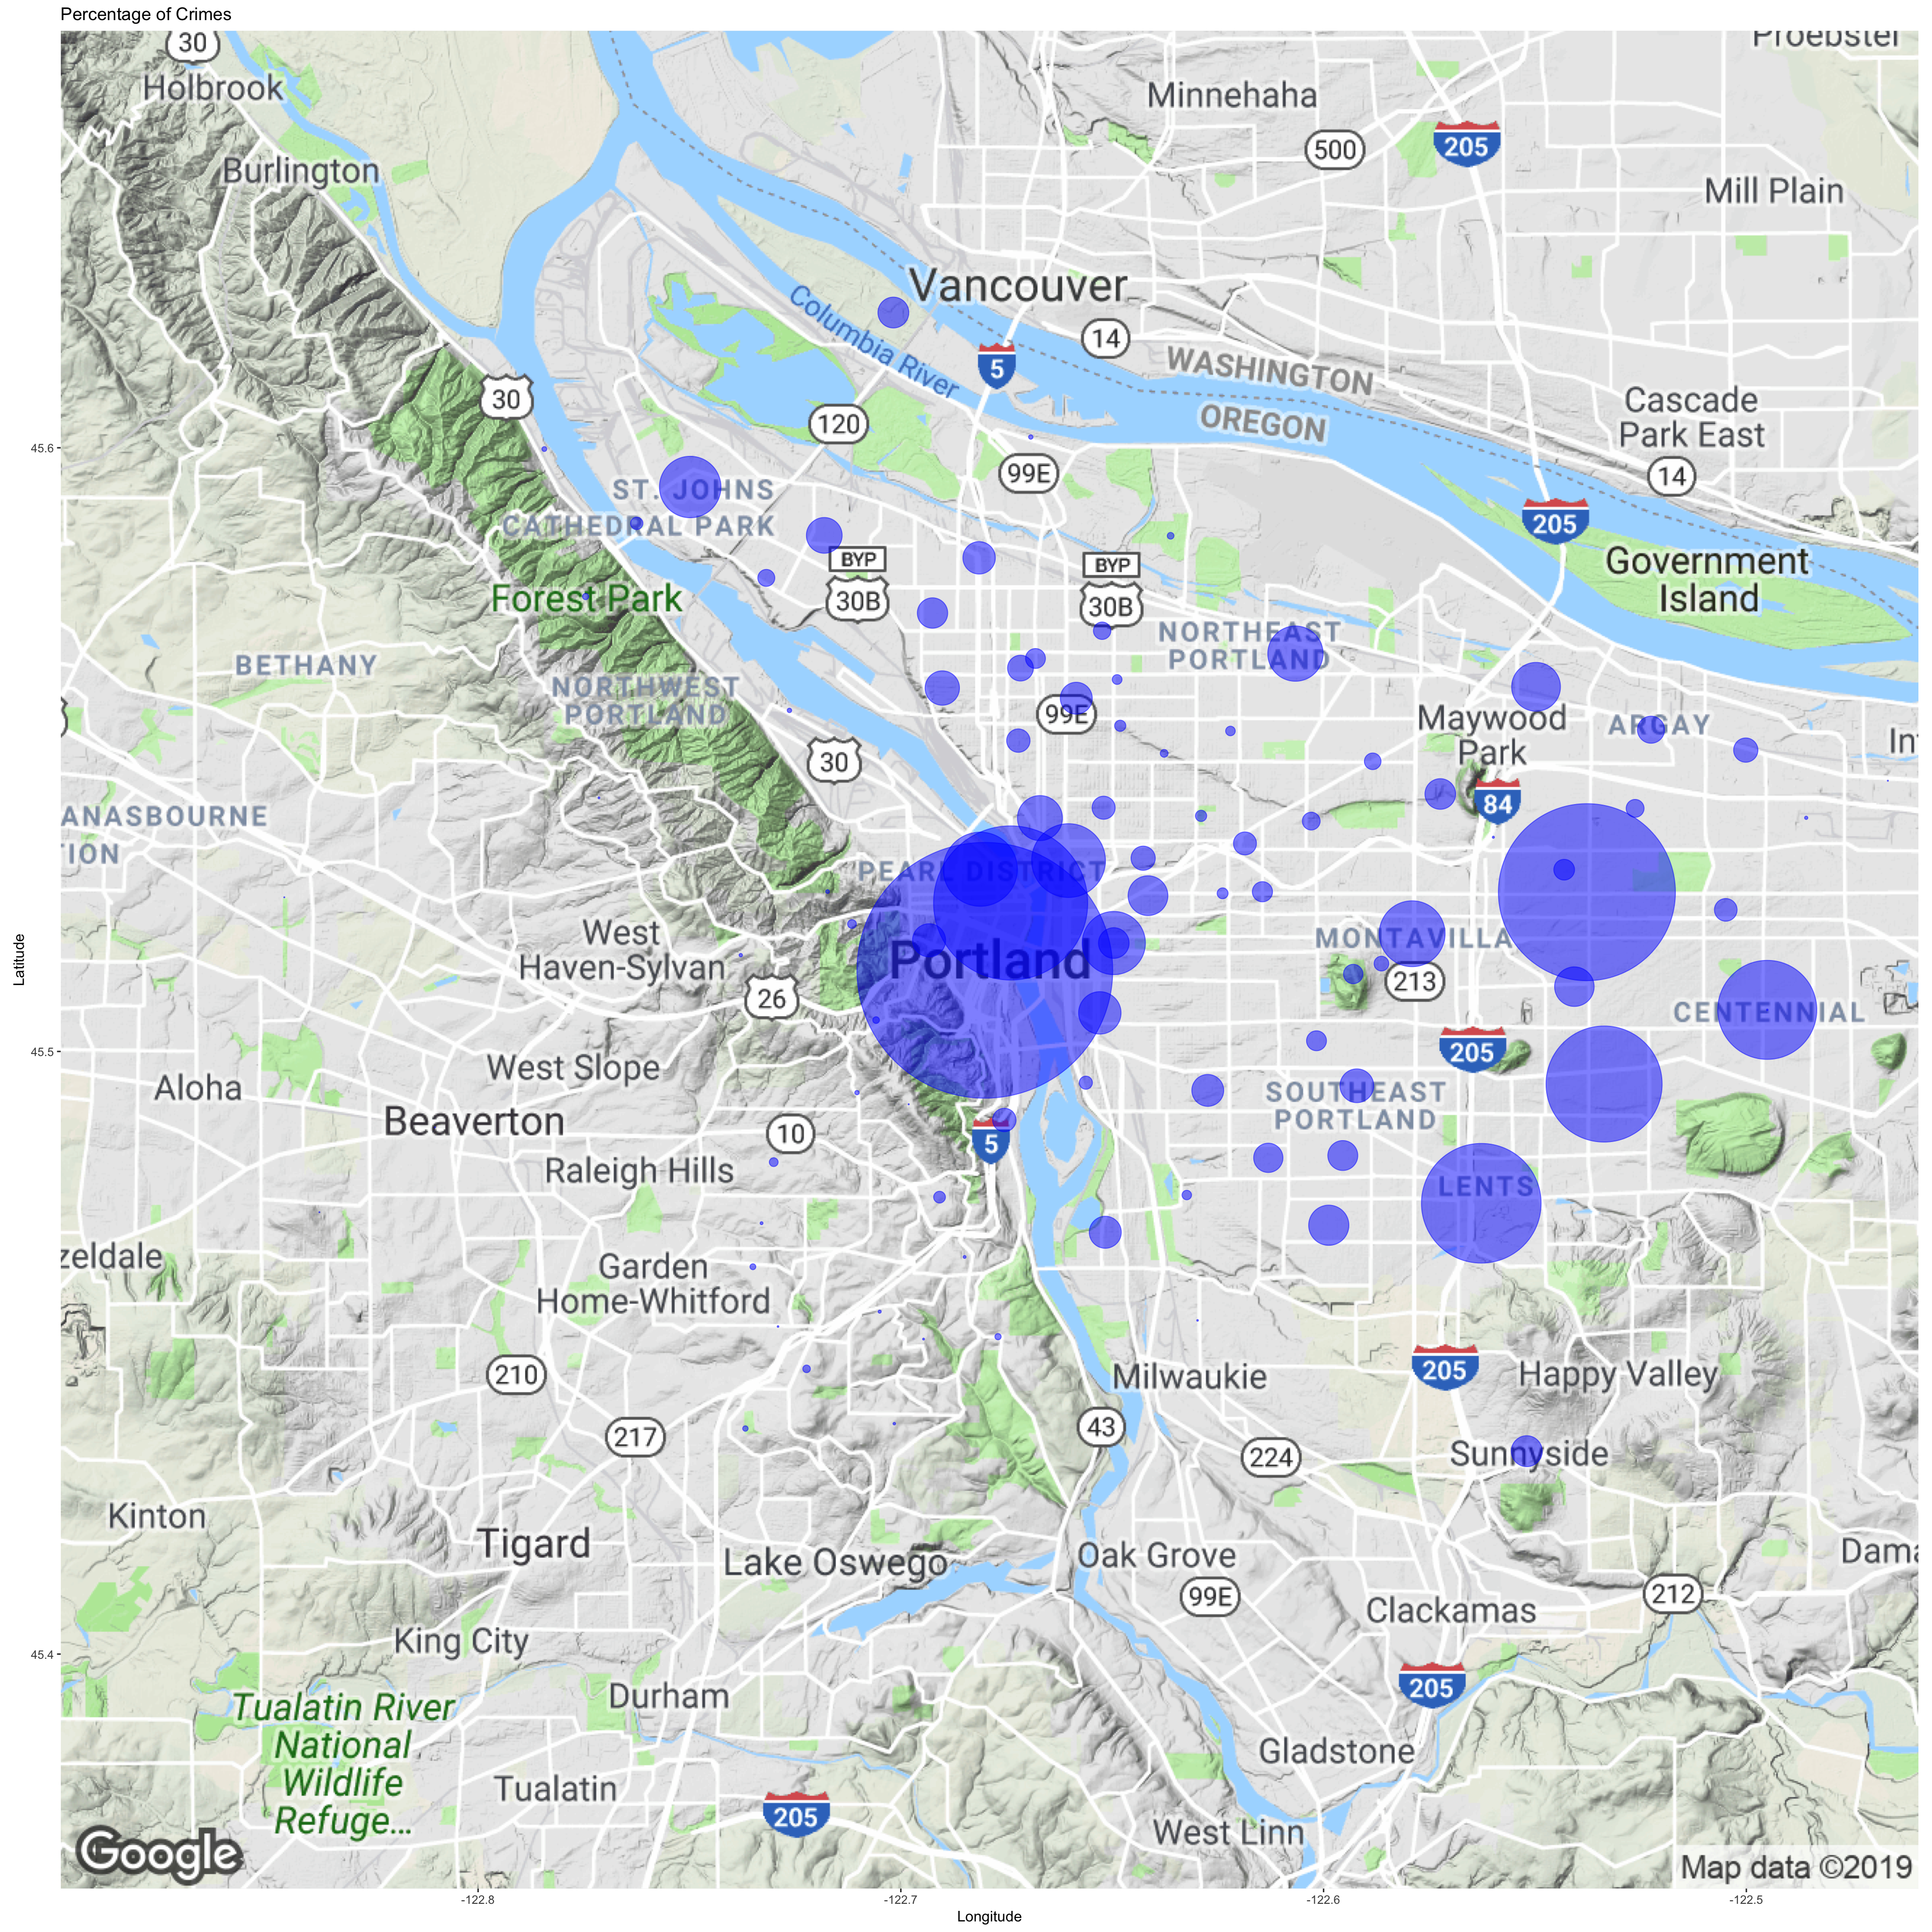
###Overall Crime Mapped
Below there is a map that depicts the number of crimes as a percentage of the total. The data is represented this way so that the viewer can see where the “most” crime is happening.
###2014 Averages of Each Crime Type
The graph below contains the daily 2014 averages for each type of crime covered in this document.
###Overall Crime: Neighborhoods with Most (Top 10)
Below is a list of the “top 10” neighborhoods for the covered crimes.
| Neighborhood | Count |
|---|---|
| DOWNTOWN , OR | 5394 |
| HAZELWOOD , OR | 3727 |
| CHINA/OLD TOWN , OR | 3243 |
| LENTS , OR | 2513 |
| POWELHST-GILBRT , OR | 2437 |
| CENTENNIAL , OR | 2076 |
| NORTHWEST , OR | 2047 |
| PEARL , OR | 1549 |
| LLOYD , OR | 1542 |
| MONTAVILLA , OR | 1374 |